Official uptime monitoring
Uptime monitoring with workspace, alerts, and status pages
Tracerail runs synthetic checks on the endpoints your team relies on, keeps history in one workspace, and lets paid plans publish a read-only status page—without exposing raw monitor URLs.
Free tier · HTTP, SSL, DNS & browser checks · No card to sign up
Checks
HTTP, response time, SSL/TLS, DNS, screenshots
Workspace
Monitors, history, and plan limits in one place
Status
Shareable public page on paid tiers
Built for small teams and builders
Everything you need to know a URL is up—before your users or customers do.
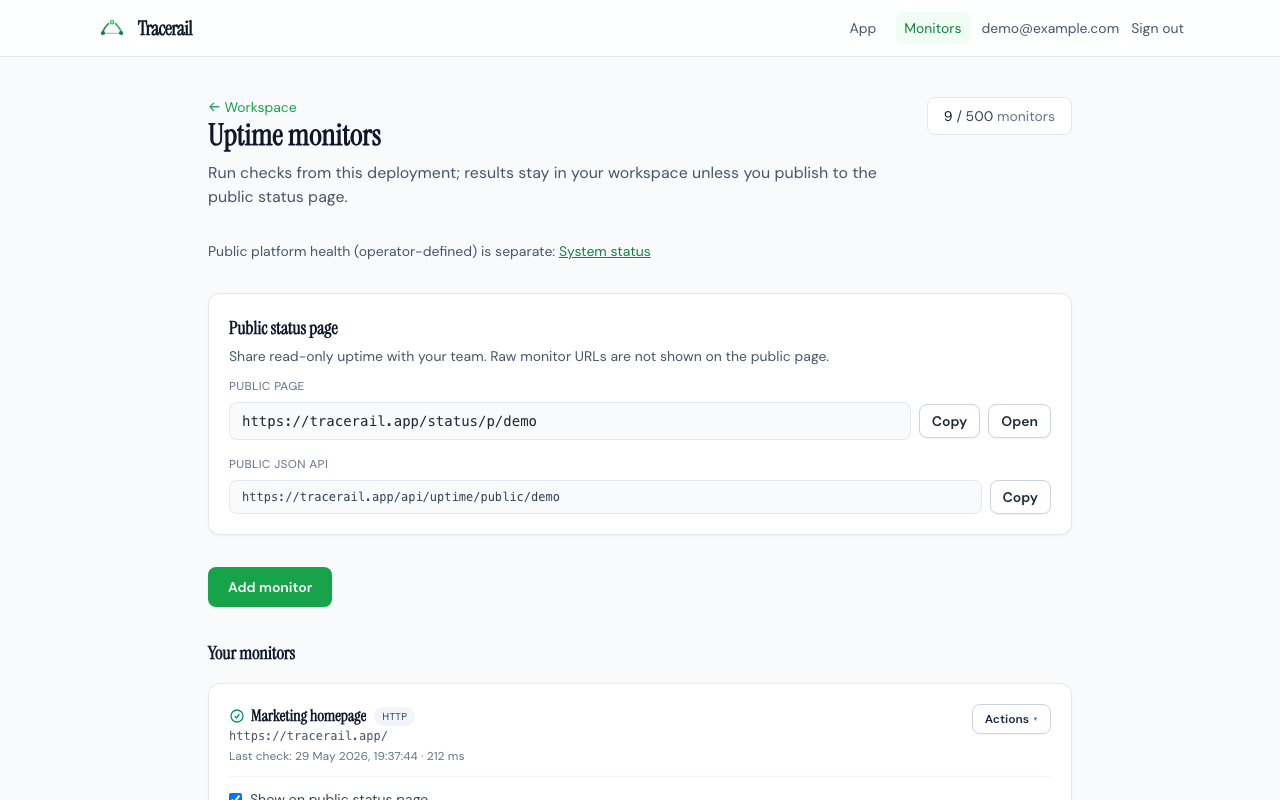
Uptime monitors
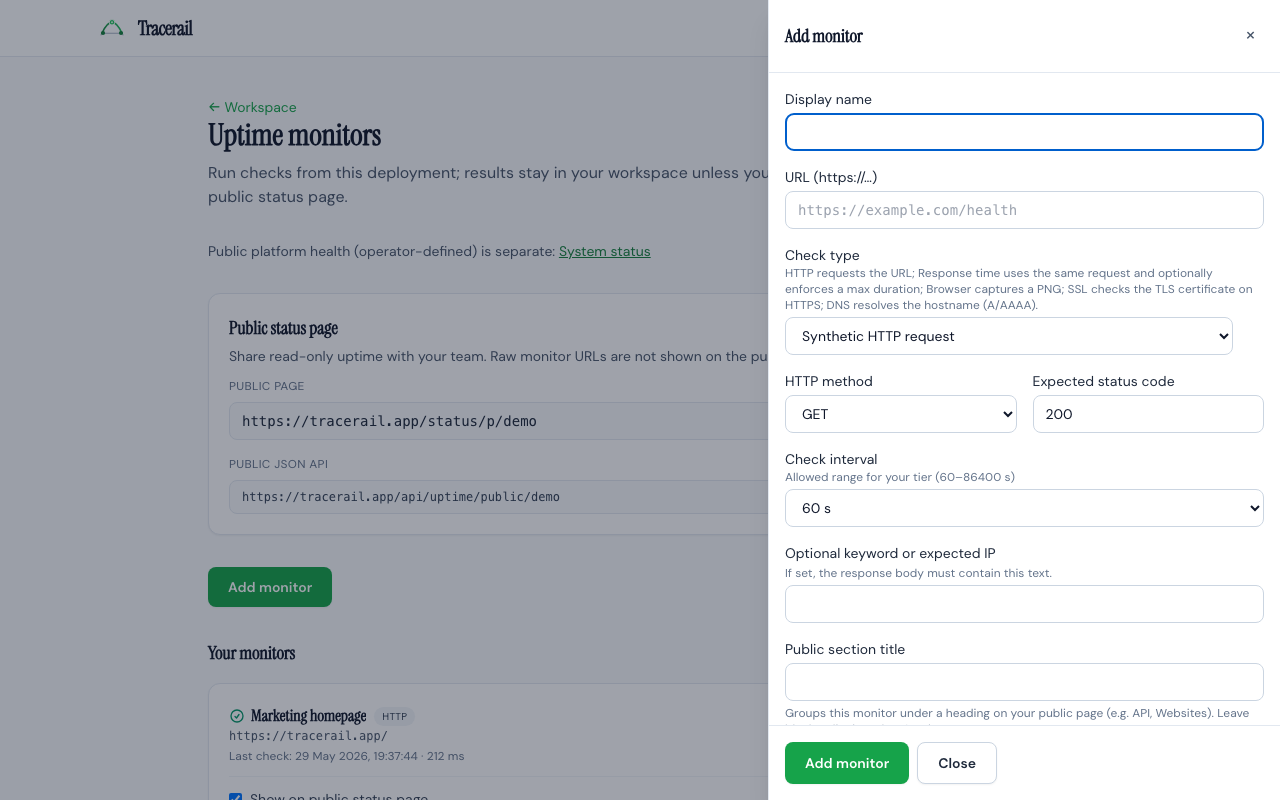
Schedule synthetic HTTP checks, optional keyword match, SSL expiry, DNS resolution, and headless browser screenshots from one monitors list.
Plans & billing
Start on the free tier and upgrade when you need more monitors, faster intervals, longer history, or a customer-facing status page.
CLI, MCP & API
Automate with the Tracerail CLI or MCP server using personal API tokens—same checks and workspace data without the browser.
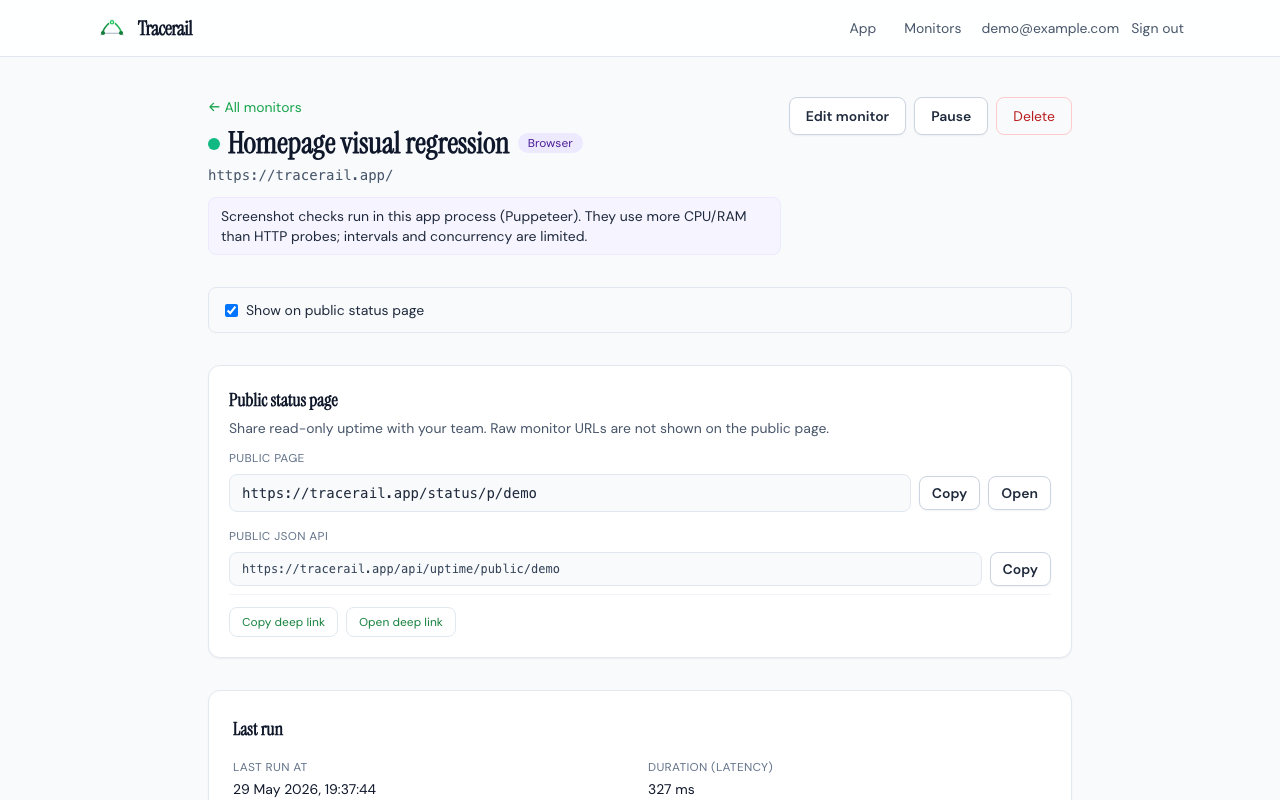
See the workspace
Monitors list, add-monitor drawer, and latest screenshot check—sample UI from the demo workspace.
Why teams use Tracerail
Synthetic checks you control
Set URL, method, expected status, intervals, and pause or resume—results stay in your account until you share a status page.
Alerts when things break
Configure webhooks and optional email when checks fail or recover, with cooldown you control per monitor.
Public status (paid)
Publish a read-only status page with monitors you choose; endpoint URLs never appear on the public view.
Frequently asked questions
What is uptime monitoring?
Uptime monitoring runs scheduled synthetic checks against your URLs or services—HTTP status, latency, SSL certificates, DNS, or browser screenshots—so you know about outages before users report them.
What can Tracerail monitor?
HTTP and HTTPS endpoints with expected status codes, optional body keywords, response-time limits, SSL/TLS expiry, DNS A/AAAA records, and optional Puppeteer screenshot checks. Private hosts like 127.0.0.1 are blocked in production unless explicitly allowed for development.
Is there a free plan?
Yes. The free tier includes core monitoring with lower caps on monitor count and check frequency. Upgrade from pricing when you need more checks, history, alerts, or a public status page.
How does the public status page work?
On paid tiers you choose a slug and mark which monitors appear on a read-only page. Visitors see up/down state and recent check results—not the underlying URLs you monitor.
Can I automate checks without the web UI?
Yes. Create API tokens in your workspace and use the Tracerail CLI or MCP integration to list monitors, trigger runs, and manage settings from scripts or AI tools like Cursor.
Start monitoring in minutes
Create a free account, add your first URL, and upgrade when you outgrow the free tier.